
Claims evidence check

How much of your claim decision rests on customer imagery?

Twelve questions about your claims flow and how photos and video feed into it. Estimates are fine, and three questions are optional. You then see your own numbers, and what your judgement of that imagery rests on today.

Request a demo

About two minutes. Your answers stay in your browser and are stored nowhere. We only receive your contact details if you ask for the report yourself at the end.
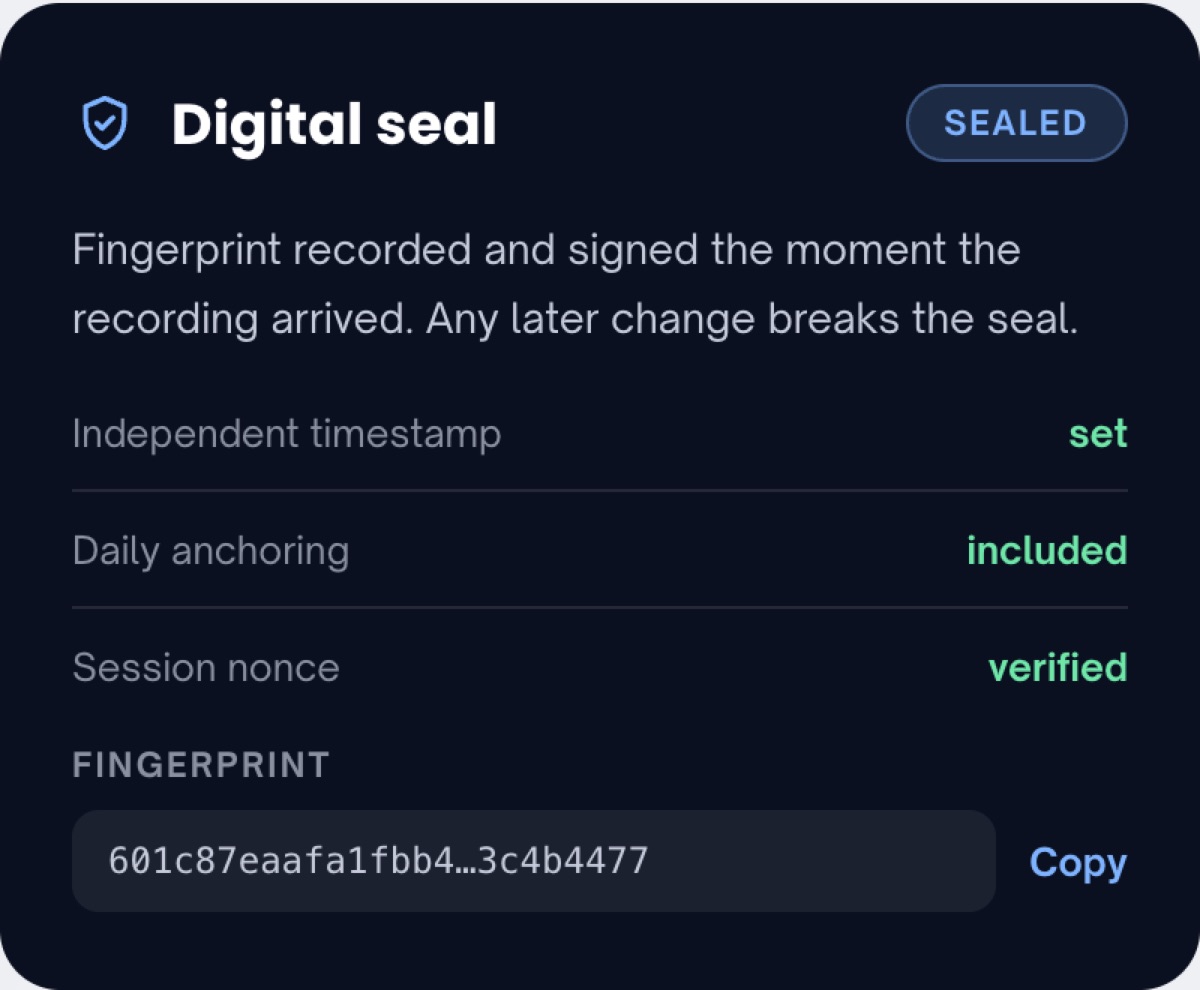
Digital seal on a capture: fingerprint, timestamp and anchoring

Your claims operation

Four questions about your claims flow, plus three optional ones below. Estimates are good enough.

Which line of business are you answering for? Imagery use differs sharply between product lines. Answer for several lines at once and the result averages those differences away.
Claim volumeHow many claims do you handle per year in this line? Claims reported per year, not only the ones paid. An order of magnitude is enough.
Additional information rateOn what share of claims do you have to go back to the claimant for more information or evidence? Every time the file has to go back for an extra photo, a receipt or an explanation. Even a single follow-up question counts.
0%
0%100%
Inspection rateOn what share of claims do you send a loss adjuster, surveyor or inspector on site? What you settle from the desk follows from this, so you do not need to enter it separately. An adjuster reviewing remotely counts as desk-based.
0%attended on site
0% · neveralways · 100%
attended on site
settled from the desk
Your first result
Optional, if you have the figures to hand

These three add detail to your result, but the check works without them. Feel free to skip.

Average claim severityWhat is the average amount paid per claim? Shown in your result for context only. No amount is calculated from it.
Claims cycle timeWhat is the average time from notification to claim decision?days To the claim decision, not to payment.
SIU referral rateWhat share of claims do you refer to special investigations for further review?% How much you refer, not how much fraud you establish. Those are two different numbers.

Imagery in your claims process

Five questions about the photos and video your customers supply themselves.

Customer-supplied imageryOn what share of claims does the customer supply photos or video? In most portfolios this is mainly photos. Video counts if you receive it, even where you do not actively ask for it.
0%
0%100%
Decision-relevant imageryAnd on what share does that imagery actually feed the assessment or the claim decision? This follows your previous answer. Lower it where imagery is often not decisive for you, for instance on total losses or files settled on receipts or on liability.
0%
0%100%
Assessed without attendanceOn what share of thése claims is the damage assessed without an adjuster, surveyor or inspector attending? Only across the files where imagery feeds the decision, not across your whole portfolio. That way we assume nothing about the overlap between imagery and attendance.
0%
0%100%
Image intakeHow does that imagery mainly reach you? Select all that apply. Tick the routes actually used in practice, including the informal ones.
Image controlsWhich checks are run on supplied imagery? Tick only what happens on every file as a matter of course, not what a handler could do when something looks off.

Your result

Everything below is factual: first the figures as you entered them, then those same figures worked through, and finally how your imagery flow is set up.

Take this report with you

Leave your details and save your own numbers and the calculation as a pdf straight away. You can share it internally afterwards.

Done. Choose “Save as PDF” in the print dialog.

Curious how you could achieve these results?

Digital seal on a capture Book a demo