
What is claim frequency: claim frequency explained
Claim frequency is the rate at which claims arise across a book of business, normally expressed as the number of claims per 100 earned exposure units over a defined period. In motor insurance the exposure unit is the earned car year, so frequency is read as claims per 100 earned car years.
For insurers
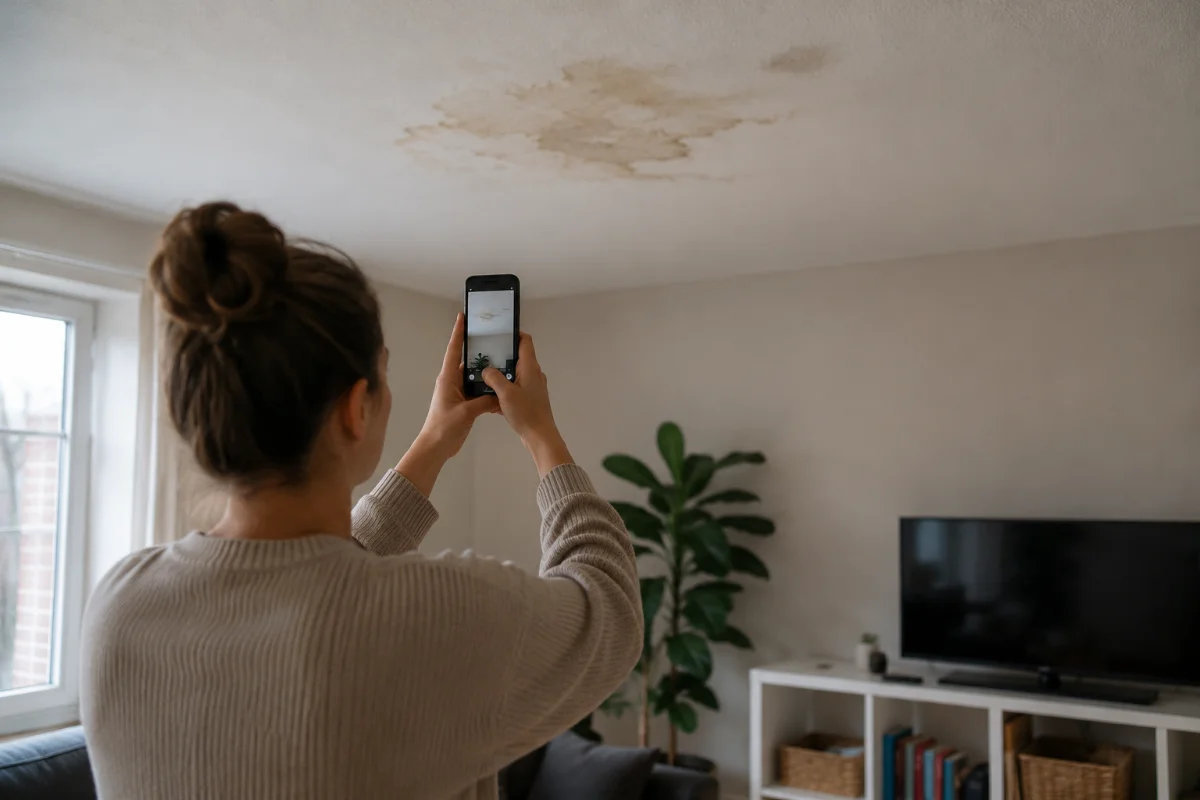
See the damage before you send anyone
Venta Capture, a product of VentaVid, sends the policyholder a link. They film the damage on their own phone, guided step by step, and the evidence lands with the claim.
It is one half of the pair that sets the loss cost on any portfolio. The other half is claim severity, the average cost of a claim once it has happened.
How is claim frequency calculated?
The formula is short. Divide the number of claims in the period by the earned exposure in the same period, then multiply by 100. Everything difficult about the metric is in the definitions, not the arithmetic.
- Claim count: claims reported, or claims incurred, in the measurement window. Which one you pick changes the answer, so state it on the report.
- Earned exposure: an earned car year is 365 days of cover on one vehicle. Two vehicles insured for six months each equal one earned car year.
- Coverage split: frequency is calculated per coverage, not per policy. One accident can produce a collision claim and a property damage liability claim.
- Period basis: accident year, policy year, or calendar year. Comparing an accident year figure against a calendar year figure is the most common reporting error in the whole metric.
Read as a decimal it is simply a percentage of insured units. A collision frequency of 4.20 per 100 earned car years means roughly one vehicle in 24 had a collision claim that year.
Claim frequency and claim severity: a pair, not a metric
Frequency counts how often. Severity counts how much. Multiply the two and you get the pure premium, the expected loss cost per unit of exposure before expenses and margin.
They move independently, and often in opposite directions, which is why reading either one alone misleads. Data published by the Insurance Information Institute from ISO, a Verisk business, shows the split clearly for US private passenger auto in 2021.
- Bodily injury liability: 0.78 claims per 100 earned car years, average payment $22,734.
- Property damage liability: 2.28 per 100, average payment $5,314.
- Collision: 4.20 per 100, average payment $5,010.
- Comprehensive: 3.15 per 100, average payment $2,042.
Bodily injury is the rarest of the four and by far the most expensive per claim. Comprehensive is four times more frequent and costs about a tenth as much each time. A claims operation staffed on frequency alone would put its most experienced people in the wrong queue.
Claim frequency explained: a worked example
A motor book carries around 40,000 vehicles, with policies joining and cancelling through the year, and earns 36,500 car years in total. Collision claims reported come to 1,715.
1,715 divided by 36,500, multiplied by 100, gives a collision frequency of 4.70 per 100 earned car years. If the prior year ran at 4.20, that is a 12% rise in how often claims happen, and it will show up in the reserving run long before anyone has agreed why.
What actually moves the number
- Exposure mix: miles driven, urban share, vehicle age and driver profile change frequency without anything changing in claims handling at all.
- Weather and seasonality: hail, freeze and storm events arrive in comprehensive and property frequency as spikes, not as trends.
- Deductible and excess levels: raising the excess suppresses small claims. Frequency falls, severity rises, and the loss cost may not move.
- Reporting propensity: easier notification channels lift reported frequency. That is customer behaviour, not risk.
- Vehicle technology: driver assistance reduces some collision types while raising the cost of the ones that still occur.
Where claims teams read frequency wrong
- Counting nil claims: files opened and closed without payment inflate the figure. Decide whether you count reported or paid claims, then stay consistent.
- Using immature data: recent accident periods are not fully developed, so frequency on a young year always looks low until the late reports land.
- Mixing policy count with exposure: claims per 100 policies is not claims per 100 earned car years, and multi-vehicle policies break the comparison entirely.
- Treating a fall as good news: it can mean customers are absorbing small losses to protect a no-claims discount, which resurfaces later as churn.
- Ignoring the coverage split: a portfolio frequency is an average of several very different distributions, and the average describes none of them.
Frequency is a planning metric rather than an operational one. It tells you how much work is coming and roughly what shape it arrives in. What happens to each of those claims after it arrives gets measured elsewhere, in claims cycle time, leakage, and reopen rate.
For a claims operation the practical use is capacity. A half point move in collision frequency on a 36,500 car year book is roughly 180 extra files, which is a staffing question at first notification of loss and a routing question at every stage after it. Getting the intake right is what stops that volume turning into longer cycle times across the whole book.
In practice: see how insurers use Venta Capture for remote claim inspection.