Venta Capture, a product of VentaVid, is a guided visual capture platform: your customer, tenant, driver or contractor films what you need on their own phone, guided step by step, with no app and no account, and it arrives as a sealed, structured case in your team's inbox. Because every case has a flow, an owner, a status and a timeline, the numbers come from the work itself.
Submissions, turnaround and statuses, per flow, per team, per period. Read from the same cases, not a separate spreadsheet.
Evidence that arrives by WhatsApp and email cannot be counted. Nobody knows how many requests went out last month, how many came back, how long a case waited before somebody looked at it, or which team is behind.
The service manager guesses how many intakes were handled remotely.
The claims lead cannot show the auditor how long a case sat in "new".
A flow that customers abandon halfway looks the same as one that works.
Every capture link belongs to a form and a tenant, and is created by an account. That is where counting starts.
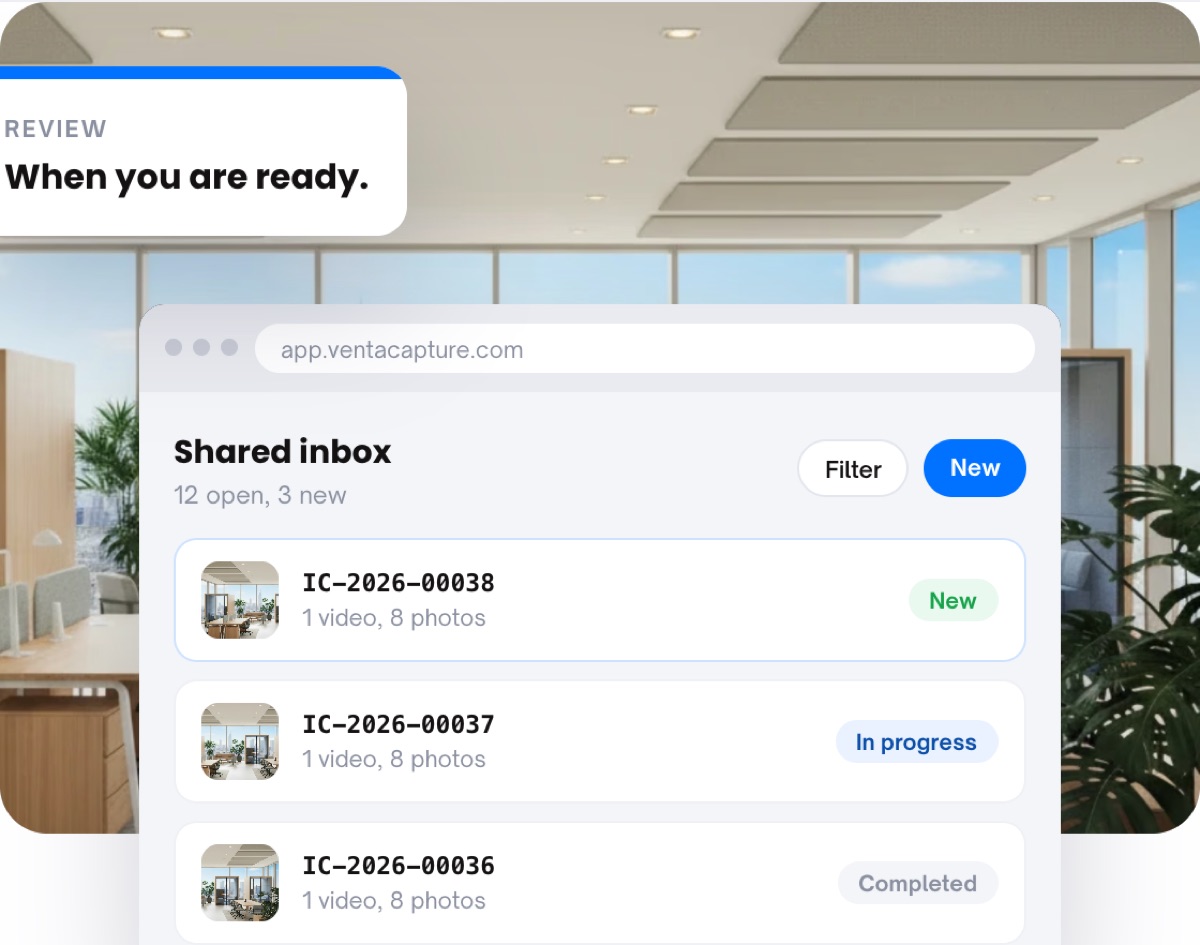
The customer films on their own phone. Each submission is a case with a reference number, a receipt time and a status.
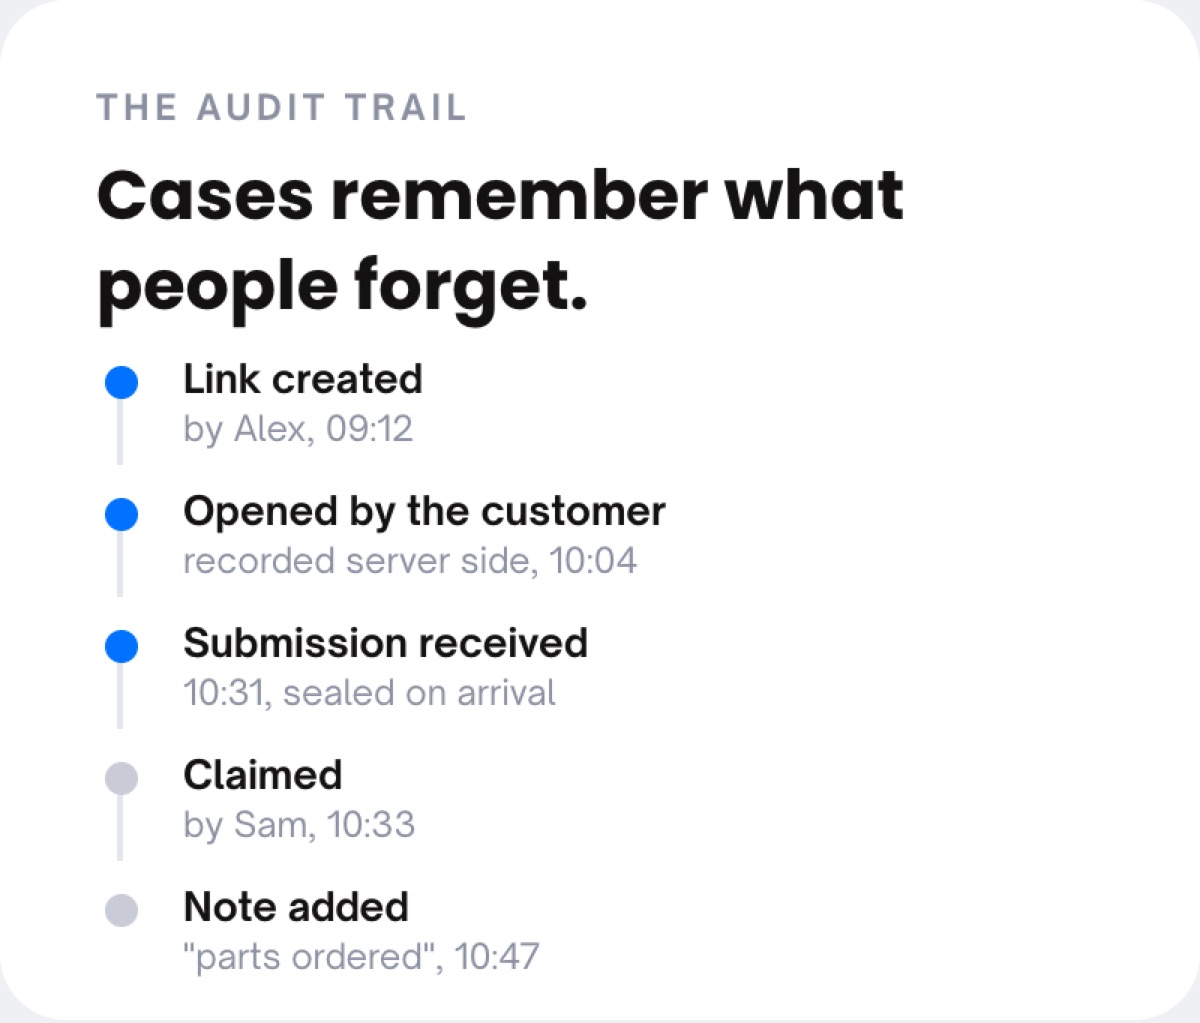
The case records when the link was created, when it was opened, when the submission arrived, who claimed it, who assigned it, every status change and every note.
The statistics screen shows submissions, turnaround and statuses per flow, per team and per period, so the person running the department sees what the inbox does not show at a glance.
How many submissions came in through the damage flow this month, how many through the intake flow, and how that compares with the period before. The number of visits and calls you avoided starts with knowing how many cases you handled remotely.
Turnaround per team and per flow shows whether cases wait for the customer or for you. Routing rules carry an SLA in hours, so the comparison against what you promised is in the same place.
Statuses are yours (New, In progress, Completed, Closed by default, or your own set), so the report speaks your process language: how many are open, how many are done, how many are stuck.
Run one flow for a month and read back what it did.
The statistics screen reports per flow, per team and per period on the cases in your tenant: how many submissions arrived, how long they took to move, and where they stand by status. It is built on the same cases and statuses your team works with in the shared inbox, so what you report is what you handled.
The activity log of each case is the source: link created and by whom, each time the customer opened it (recorded server side), the submission received, claim, assignment, notes and status changes, plus the session timeline of the capture itself.
Find and filter in the shared inbox gives the day-to-day view: filter by status, flow, owner or period and work the list. Routing rules carry an SLA in hours, and notifications can be sent immediately or batched.
For reporting inside your own systems, the API and webhooks expose case events and case data under your own reference number, so a claims platform or a BI tool can count what Capture counts.
Teams that manage on these numbers: field service, claims handlers and customer support. To turn the counts into a business case, use the worked example on the ROI page. Reports can be sliced by team once teams and roles are set up. Glossary: service level agreement, inspection cycle time, claims cycle time.
Submissions, turnaround and statuses, per flow, per team and per period. It reads from the same cases your team handles in the shared inbox.
Yes. Every case carries a timeline with the receipt time, the claim, the assignment and each status change, and routing rules carry an SLA in hours to compare against.
Reports follow your organisation model: per flow and per team, and tenants keep their own cases. Set up teams and tenants first and the reporting follows.
Yes, through the REST API and webhooks, under your own reference number. See integrations and API.
It reports what was handled through Capture. Whether a case replaced a visit or a call is your team's judgement; the ROI page shows how to work that out with your own numbers.
One flow, one month, and a report that shows what came in, how fast it moved and what is still open.
Live in 10 minutes. Stuck? Book a free setup call and we build your first flow together.
